pyvista.DataObjectFilters.scale#
- DataObjectFilters.scale(
- xyz: float | VectorLike[float],
- transform_all_input_vectors: bool = False,
- inplace: bool = False,
- point: VectorLike[float] | None = None,
メッシュをスケールします.
注釈
See also the notes at
transform()which is used by this filter under the hood.- パラメータ:
- xyz
float|VectorLike[float] スカラー,またはベクトルで,x, y, z 方向のスケールファクターを定義します.
- transform_all_input_vectorsbool, default:
False Trueの時,全ての入力ベクトルは変換される.それ以外の場合は,ポイント,法線,およびアクティブなベクトルだけが変換されます.- inplacebool, default:
False in-placeメッシュを更新します.
- point
VectorLike[float],optional 拡大縮小する点.デフォルトは原点です.
- xyz
- 戻り値:
DataSet|MultiBlockScaled dataset. Return type matches input unless input dataset is a
RectilinearGrid, in which case the output datatype is aStructuredGrid.
参考
pyvista.Transform.scaleスケール行列と変換を連結します。
例
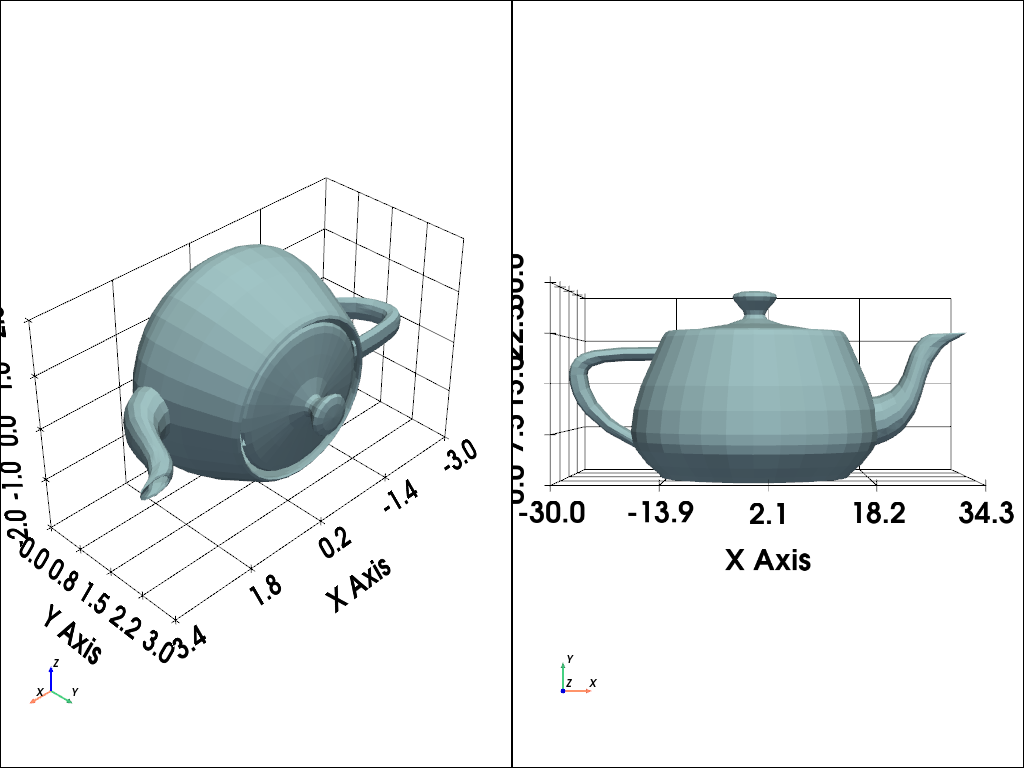
>>> import pyvista as pv
>>> from pyvista import examples
>>> mesh1 = examples.download_teapot()
>>> mesh2 = mesh1.scale([10.0, 10.0, 10.0], inplace=False)
Plot meshes side-by-side
>>> pl = pv.Plotter(shape=(1, 2))
>>> # Create plot with unscaled mesh
>>> pl.subplot(0, 0)
>>> _ = pl.add_mesh(mesh1)
>>> pl.show_axes()
>>> _ = pl.show_grid()
>>> # Create plot with scaled mesh
>>> pl.subplot(0, 1)
>>> _ = pl.add_mesh(mesh2)
>>> pl.show_axes()
>>> _ = pl.show_grid()
>>> pl.show(cpos='xy')