ポイントセット#
PyVistaポイントセットは,ポイントとセルのトポロジーが指定され,推測されない,明示的なジオメトリを持つデータセットです. PyVistaポイントセットは,VTKのポイントセットと同じデータモデルを採用していますが,作成,配列へのアクセス,プロッティングがVTKのものよりも簡単にできるように設計されています.
pyvista.UnstructuredGrid クラスは,可能なすべてのセルタイプの任意の組み合わせに使用されます.
pyvista.PolyData は,サーフェイスのジオメトリ(例えば,頂点,ライン,ポリゴンなど)からなるデータセットに使用します.
pyvista.StructuredGrid は,位相的に規則正しいデータの配列に使用されます.
pyvista.PointSet ( vtk==9.1.0 以降)は,点の集合を保存するための具象クラスです.
クラスの説明
以下の表は,PyVistaのポイントセットクラスの説明です. これらのクラスは,対応する VTK の vtkPointSet, vtkPolyData, vtkUnstructuredGrid, vtkStructuredGrid, vtkExplicitStructuredGrid のスーパークラスからすべてのメソッドを継承しています.
|
点の集合を格納するための具象クラスです. |
|
表面形状(頂点,線,ポリゴンなど)で構成されるデータセット. |
|
データセットは,可能なすべてのセルタイプの任意の組み合わせに使用されます. |
|
トポロジー的に規則的な配列のデータに使用されるデータセットです. |
|
|
PolyDataの作成#
空のオブジェクト#
pyvista.PolyData オブジェクトは次のように初期化できます.
import pyvista
mesh = pyvista.PolyData()
これでメッシュが作成され,これに
なお, pyvista.UnstructuredGrid とは異なり,セルの種類は指定しません. すべての面はポリゴンであると想定されているため, "Poly" データと呼ばれています.
Click on the attributes above to see examples of how to add geometric
features to an empty. See PolyDataを作成 for an example on
creating a pyvista.PolyData object from NumPy arrays.
ファイルから初期化#
バイナリファイルもASCII .ply, .stl, と .vtkファイルもPyVistaで読むことができます.たとえば,PyVistaパッケージにはメッシュの例が含まれており,次のようにしてロードできます.
import pyvista
from pyvista import examples

# Load mesh
mesh = pyvista.PolyData(examples.planefile)
mesh
| PolyData | Information |
|---|---|
| N Cells | 2452 |
| N Points | 1335 |
| N Strips | 0 |
| X Bounds | 1.391e+02, 1.655e+03 |
| Y Bounds | 3.209e+01, 1.320e+03 |
| Z Bounds | -1.774e+01, 2.821e+02 |
| N Arrays | 0 |
このメッシュは,次を使用して.vtkファイルに書き込むことができます.
mesh.save('plane.vtk')
これらのメッシュは同一です.
import numpy as np

mesh_from_vtk = pyvista.PolyData('plane.vtk')
print(np.allclose(mesh_from_vtk.points, mesh.points))
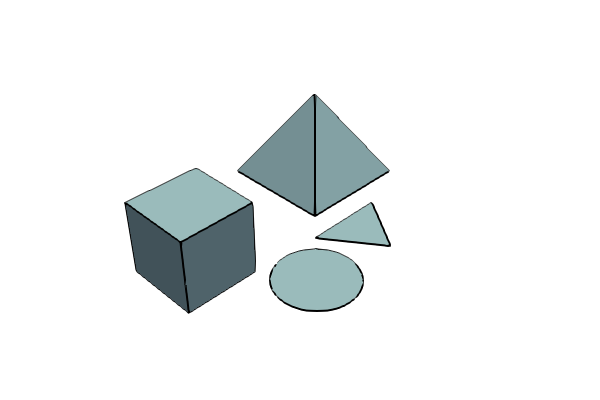
メッシュ操作とプロット#
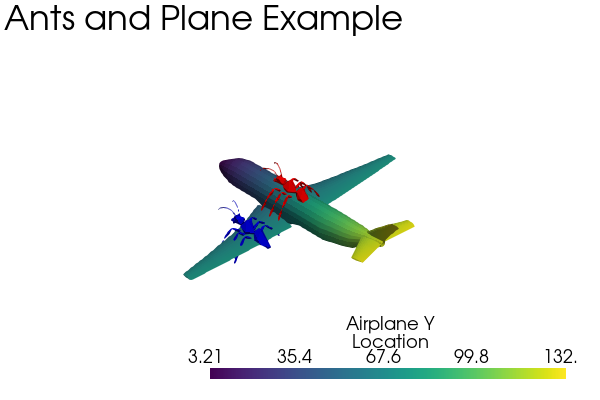
メッシュは,NumPyまたは組み込みの移動と回転ルーチンを使用して直接操作できます.この例では,2つのメッシュをロードし,移動,スケーリング,コピーして,最後にプロットします.
複数のメッシュをプロットするには,プロットを管理するための pyvista.Plotter インスタンスを作成する必要があります. 以下のコードでは,プロッターを作成し,メッシュを様々な色でプロットしています.
import pyvista
from pyvista import examples

# load and shrink airplane
airplane = pyvista.PolyData(examples.planefile)
airplane.points /= 10 # shrink by 10x

# rotate and translate ant so it is on the plane
ant = pyvista.PolyData(examples.antfile)
ant.rotate_x(90, inplace=True)
ant.translate([90, 60, 15], inplace=True)

# Make a copy and add another ant
ant_copy = ant.copy()
ant_copy.translate([30, 0, -10], inplace=True)

# Create plotter object
plotter = pyvista.Plotter()
plotter.add_mesh(ant, 'r')
plotter.add_mesh(ant_copy, 'b')

# Add airplane mesh and make the color equal to the Y position. Add a
# scalar bar associated with this mesh
plane_scalars = airplane.points[:, 1]
plotter.add_mesh(airplane, scalars=plane_scalars,
                 scalar_bar_args={'title': 'Airplane Y\nLocation'})

# Add annotation text
plotter.add_text('Ants and Plane Example')
plotter.show()
非構造格子の作成#
See 非構造化グリッドの作成 for an example on how to create an unstructured grid from NumPy arrays.
作成#
非構造格子は,次のように初期化できます:
import pyvista as pv
grid = pv.UnstructuredGrid()
これは空のグリッドを作成し,ポイントやセルが追加されるまでは役に立ちません.ポイントとセルは points, cells, celltypes を使って後から追加することができます.
また,初期化時にポイントやセルを直接追加することもできます.
>>> import numpy as np
>>> import pyvista
>>> from pyvista import CellType
>>> cells = np.array(
...     [8, 0, 1, 2, 3, 4, 5, 6, 7, 8, 8, 9, 10, 11, 12, 13, 14, 15]
... )
>>> cell_type = np.array(
...     [CellType.HEXAHEDRON, CellType.HEXAHEDRON], np.int8
... )
>>> cell1 = np.array(
...     [
...         [0, 0, 0],
...         [1, 0, 0],
...         [1, 1, 0],
...         [0, 1, 0],
...         [0, 0, 1],
...         [1, 0, 1],
...         [1, 1, 1],
...         [0, 1, 1],
...     ],
...     dtype=np.float32,
... )
>>> cell2 = np.array(
...     [
...         [0, 0, 2],
...         [1, 0, 2],
...         [1, 1, 2],
...         [0, 1, 2],
...         [0, 0, 3],
...         [1, 0, 3],
...         [1, 1, 3],
...         [0, 1, 3],
...     ],
...     dtype=np.float32,
... )
>>> points = np.vstack((cell1, cell2))
>>> grid = pyvista.UnstructuredGrid(cells, cell_type, points)
>>> grid
| UnstructuredGrid | Information |
|---|---|
| N Cells | 2 |
| N Points | 16 |
| X Bounds | 0.000e+00, 1.000e+00 |
| Y Bounds | 0.000e+00, 1.000e+00 |
| Z Bounds | 0.000e+00, 3.000e+00 |
| N Arrays | 0 |
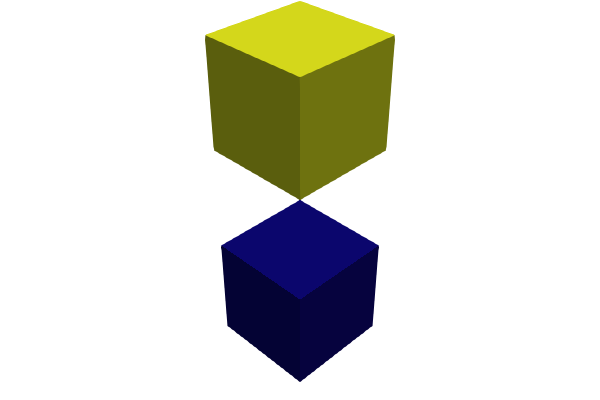
これをカラーでプロットすることができます.
>>> grid.plot(scalars=[0, 1], cmap='plasma')
ファイルからロードする#
非構造格子は,vtkファイルからロードできます.
import pyvista as pv
from pyvista import examples

grid = pv.UnstructuredGrid(examples.hexbeamfile)
grid
| Header | Data Arrays | ||||||||||||||||||||||||||||||||||||||
|---|---|---|---|---|---|---|---|---|---|---|---|---|---|---|---|---|---|---|---|---|---|---|---|---|---|---|---|---|---|---|---|---|---|---|---|---|---|---|---|
|
|
構造格子の作成#
空のオブジェクト#
構造格子は,次のように初期化できます:
import pyvista as pv
grid = pv.StructuredGrid()
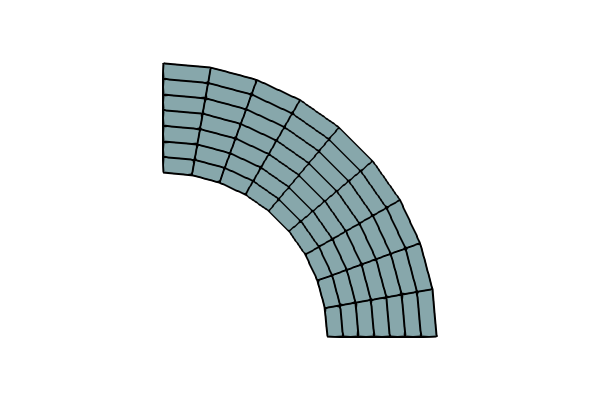
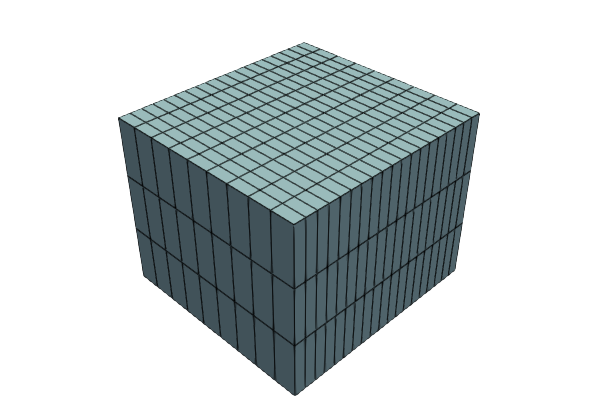
NumPyの配列からの作成#
構造格子は,numpyの配列から直接作成できます.これは,グリッドを最初から作成する場合や,別の形式からコピーする場合に便利です.
Also see 構造化サーフェスを作成する for an example on creating a structured grid from NumPy arrays.
import pyvista as pv
import numpy as np

x = np.arange(-10, 10, 1, dtype=np.float32)
y = np.arange(-10, 10, 2, dtype=np.float32)
z = np.arange(-10, 10, 5, dtype=np.float32)
x, y, z = np.meshgrid(x, y, z, indexing='ij')

# create the unstructured grid directly from the numpy arrays and plot
grid = pv.StructuredGrid(x, y, z)
grid.plot(show_edges=True)
ファイルからロードする#
構造格子は, vtk ファイルからロードできます.
grid = pv.StructuredGrid(filename)
グリッドをプロットする#
この例では, vtk ファイルから非構造格子をロードし,プロットオブジェクトを更新してプロットとGIFムービーを作成する方法を示します.
# Load module and example file
import pyvista as pv
from pyvista import examples
import numpy as np

# Load example beam grid
grid = pv.UnstructuredGrid(examples.hexbeamfile)

# Create fictitious displacements as a function of Z location
d = np.zeros_like(grid.points)
d[:, 1] = grid.points[:, 2]**3/250

# Displace original grid
grid.points += d
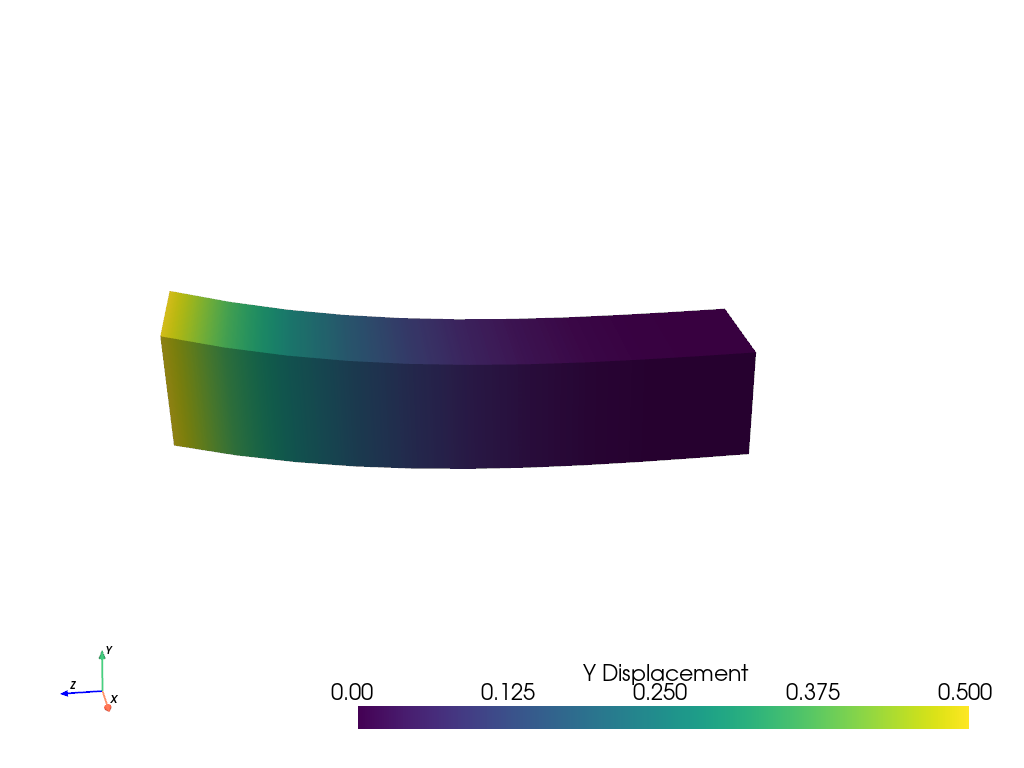
次を使用して,単純なプロットを作成できます:
# Camera position.
# it's hard-coded in this example
cpos = [(11.9151, 6.1139, 3.61249),
        (0.0, 0.375, 2.0),
        (-0.4254, 0.9024, -0.0678)]

grid.plot(scalars=d[:, 1], scalar_bar_args={'title': 'Y Displacement'}, cpos=cpos)
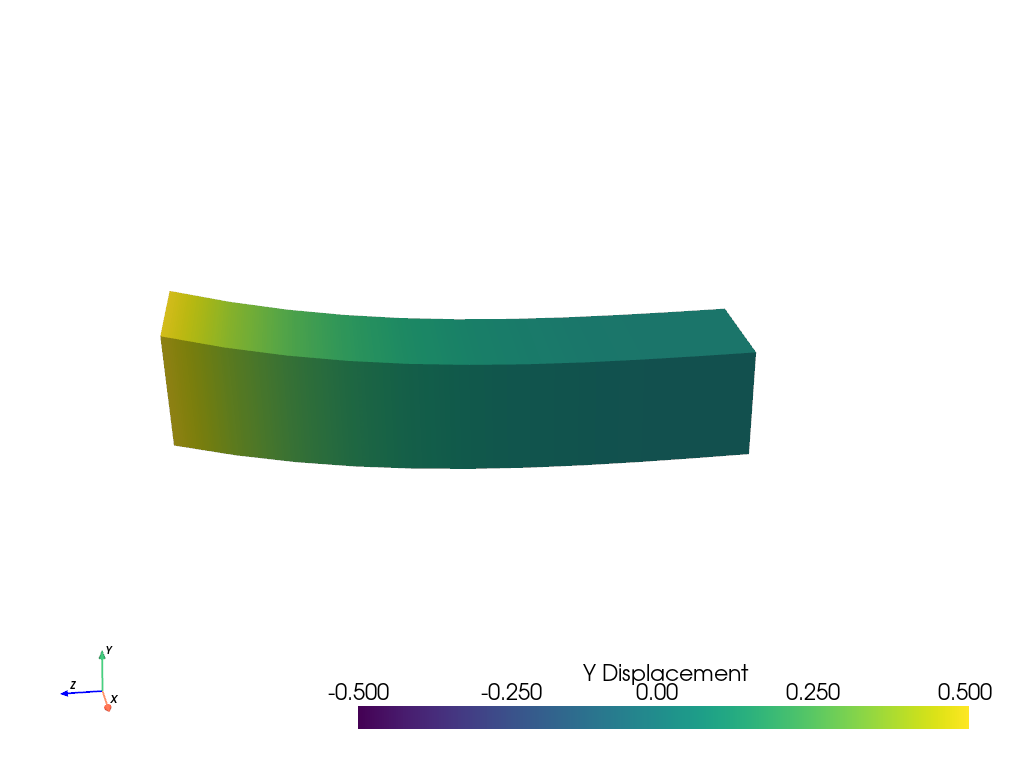
次のコマンドを使用して,より複雑なプロットを作成できます:
# plot this displaced beam
plotter = pv.Plotter()
plotter.add_mesh(grid, scalars=d[:, 1],
                 scalar_bar_args={'title': 'Y Displacement'},
                 rng=[-d.max(), d.max()])
plotter.add_axes()
plotter.camera_position = cpos
plotter.show()
はりのモーションをアニメートするには,プロットオブジェクトにコピーされたグリッドの位置とスカラーを更新します. ここでは完全な例を紹介します.
# Load module and example file
import pyvista as pv
from pyvista import examples
import numpy as np

# Load example beam grid
grid = pv.UnstructuredGrid(examples.hexbeamfile)

# Create fictitious displacements as a function of Z location
d = np.zeros_like(grid.points)
d[:, 1] = grid.points[:, 2]**3/250
grid['Y Displacement'] = d[:, 1]

# use hardcoded camera position
cpos = [(11.915, 6.114, 3.612),
        (0.0, 0.375, 2.0),
        (-0.425, 0.902, -0.0679)]

plotter = pv.Plotter(window_size=(800, 600))
plotter.add_mesh(grid, scalars='Y Displacement',
                 show_edges=True, rng=[-d.max(), d.max()],
                 interpolate_before_map=True)
plotter.add_axes()
plotter.camera_position = cpos

# open movie file. A mp4 file can be written instead. Requires ``moviepy``
plotter.open_gif('beam.gif')  # or beam.mp4

# Modify position of the beam cyclically
pts = grid.points.copy()  # unmodified points
for phase in np.linspace(0, 2*np.pi, 20):
    grid.points = pts + d * np.cos(phase)
    grid['Y Displacement'] = d[:, 1] * np.cos(phase)
    plotter.write_frame()

# close the plotter when complete
plotter.close()
はりをワイヤフレームオブジェクトとしてレンダリングすることもできます.
# Animate plot as a wire-frame
plotter = pv.Plotter(window_size=(800, 600))
plotter.add_mesh(grid, scalars='Y Displacement',
                 show_edges=True,
                 rng=[-d.max(), d.max()], interpolate_before_map=True,
                 style='wireframe')
plotter.add_axes()
plotter.camera_position = cpos

plotter.open_gif('beam_wireframe.gif')
for phase in np.linspace(0, 2*np.pi, 20):
    grid.points = pts + d * np.cos(phase)
    grid['Y Displacement'] = d[:, 1] * np.cos(phase)
    plotter.write_frame()

# close the plotter when complete
plotter.close()
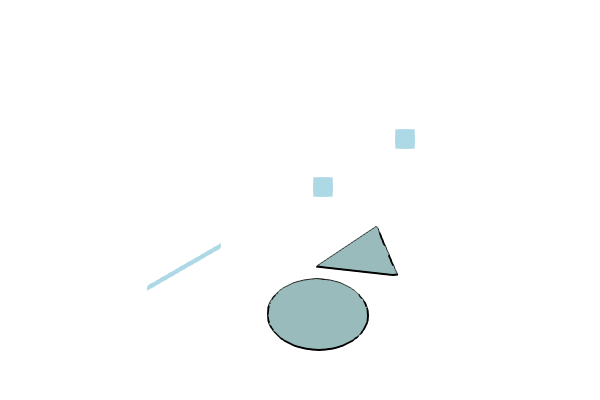
プロットにラベルを追加する#
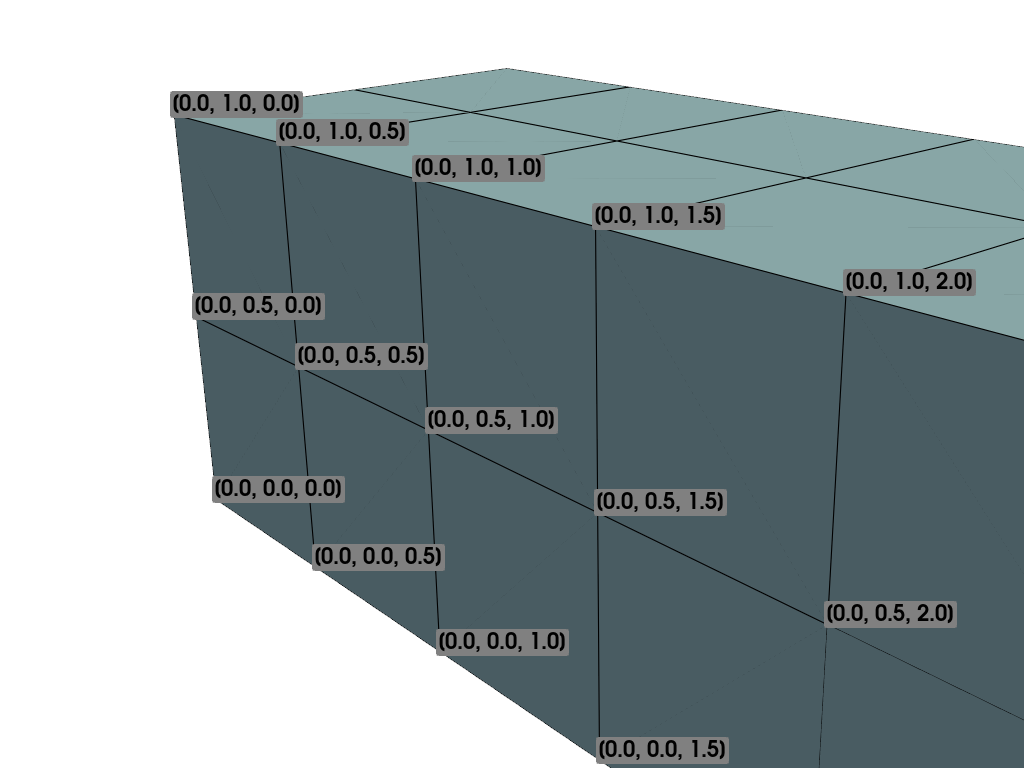
ラベルは Plotter の中で add_point_labels() を使ってプロットに追加することができます.以下の例では,同梱されているサンプルビームをロードして,プロッティングクラスを生成し,y-z平面に沿って点を副選択して,その座標をラベル付けしています. add_point_labels() では,ラベルの数が点の数と一致していることと,labelsが点ごとに1つのエントリを含みますリストであることが必要です. このコードは,リストの各項目を自動的に文字列に変換します.
# Load module and example file
import pyvista as pv
from pyvista import examples

# Load example beam file
grid = pv.UnstructuredGrid(examples.hexbeamfile)

# Create plotting class and add the unstructured grid
plotter = pv.Plotter()
plotter.add_mesh(grid, show_edges=True, color='lightblue')

# Add labels to points on the yz plane (where x == 0)
points = grid.points
mask = points[:, 0] == 0
plotter.add_point_labels(points[mask], points[mask].tolist())

plotter.camera_position = [
                (-1.4643015810492384, 1.5603923627830638, 3.16318236536270),
                (0.05268120500967251, 0.639442034364944, 1.204095304165153),
                (0.2364061044392675, 0.9369426029156169, -0.25739213784721)]

plotter.show()
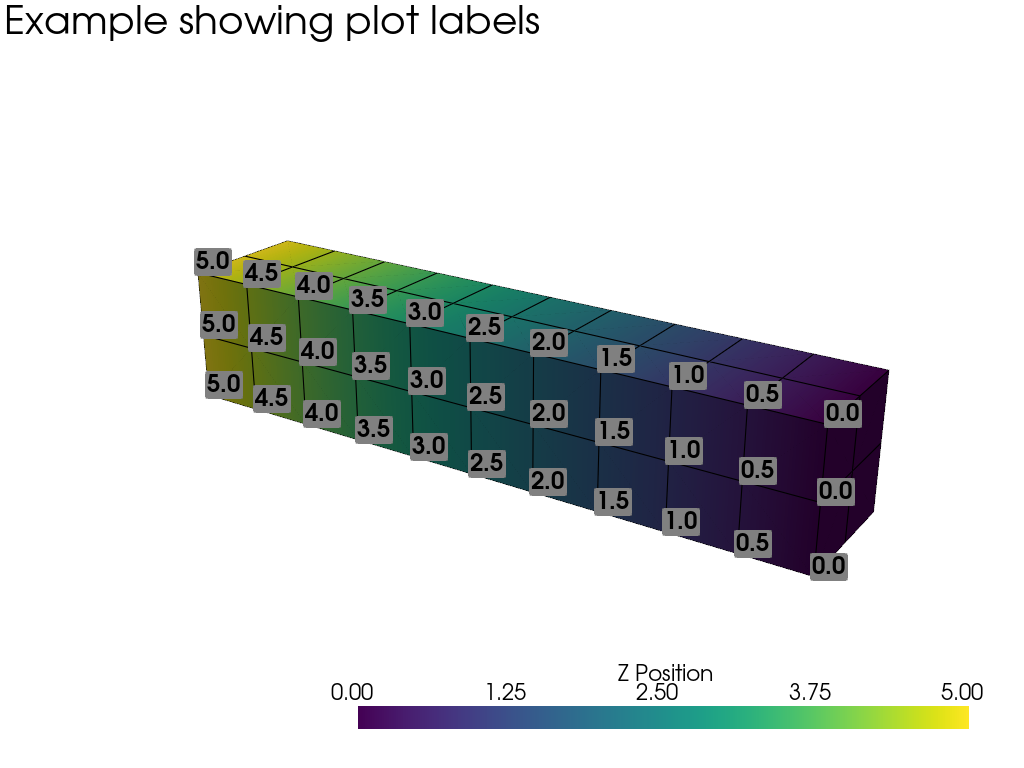
この例も同様で,ラベルをスカラーバーと組み合わせて特定のポイントの正確な値を表示する方法を示しています.
# Label the Z position
values = grid.points[:, 2]

# Create plotting class and add the unstructured grid
plotter = pv.Plotter()
# color mesh according to z value
plotter.add_mesh(grid, scalars=values,
                 scalar_bar_args={'title': 'Z Position'},
                 show_edges=True)

# Add labels to points on the yz plane (where x == 0)
mask = grid.points[:, 0] == 0
plotter.add_point_labels(points[mask], values[mask].tolist(), font_size=24)

# add some text to the plot
plotter.add_text('Example showing plot labels')

plotter.view_vector((-6, -3, -4), (0.,-1., 0.))
plotter.show()