
注釈
Go to the end to download the full example code.
カラーマップの選択肢#
Use a Matplotlib, Colorcet, cmocean, or custom colormap when plotting scalar
values with pyvista.plot() and Plotter methods.
from __future__ import annotations

from matplotlib.colors import ListedColormap
import matplotlib.pyplot as plt
import numpy as np

import pyvista as pv
from pyvista import examples
matplotlib , colorcet , cmocean 用に作成されたカラーマップはすべてPyVistaと完全に互換性があります.カラーマップは通常, cmap 引数によってカラーマップの文字列名をプロットルーチンに渡すことで指定します.
Matplotlib's complete list of available colormaps , Colorcet's complete list および cmocean's complete list を参照.
カスタムメイドのカラーマップ#
カスタムのカラーマップを使い始めるには,スカラー値を含むデータをダウンロードしてプロットします.
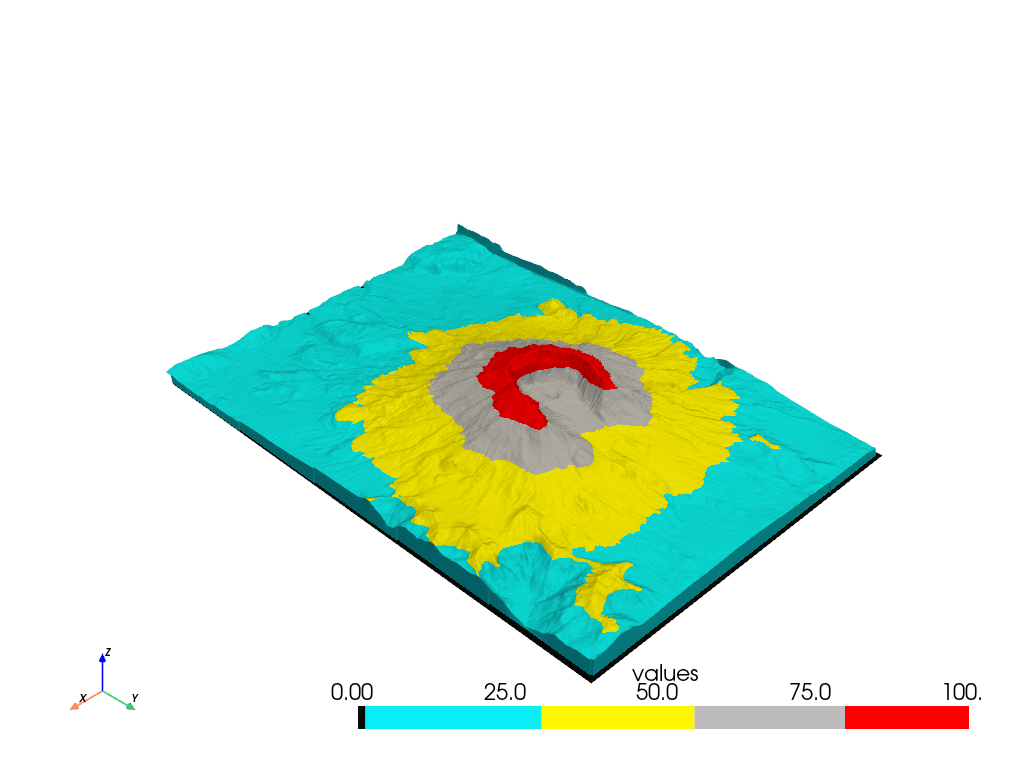
独自のカラーマップを作成します.ここでは,5つの個別の色を持つカラーマップを作成し,それらの色の範囲を指定します:
# Define the colors we want to use
blue = np.array([12 / 256, 238 / 256, 246 / 256, 1.0])
black = np.array([11 / 256, 11 / 256, 11 / 256, 1.0])
grey = np.array([189 / 256, 189 / 256, 189 / 256, 1.0])
yellow = np.array([255 / 256, 247 / 256, 0 / 256, 1.0])
red = np.array([1.0, 0.0, 0.0, 1.0])

mapping = np.linspace(mesh['values'].min(), mesh['values'].max(), 256)
newcolors = np.empty((256, 4))
newcolors[mapping >= 80] = red
newcolors[mapping < 80] = grey
newcolors[mapping < 55] = yellow
newcolors[mapping < 30] = blue
newcolors[mapping < 1] = black

# Make the colormap from the listed colors
my_colormap = ListedColormap(newcolors)
単にカラーマップを描画ルーチンに渡すだけです.
mesh.plot(scalars='values', cmap=my_colormap)
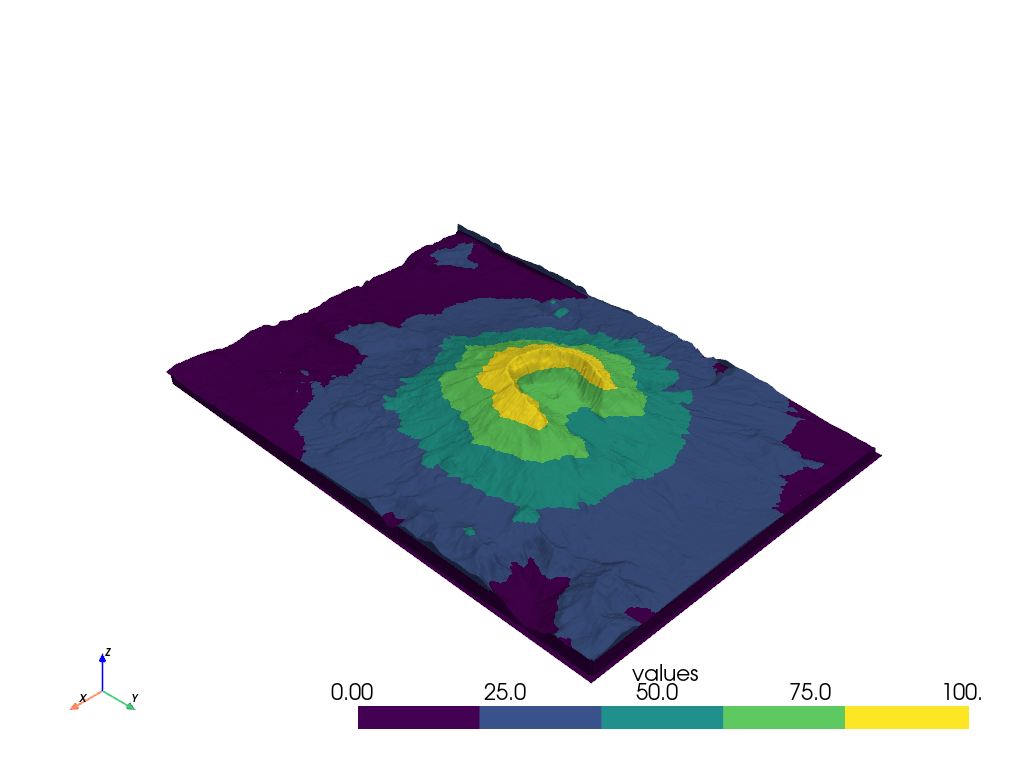
あるいは,簡単なカラーマップを作ることもできます...どんなMatplotlibカラーマップでもPyVistaに渡すことができます.
boring_cmap = plt.get_cmap('viridis', 5)
mesh.plot(scalars='values', cmap=boring_cmap)
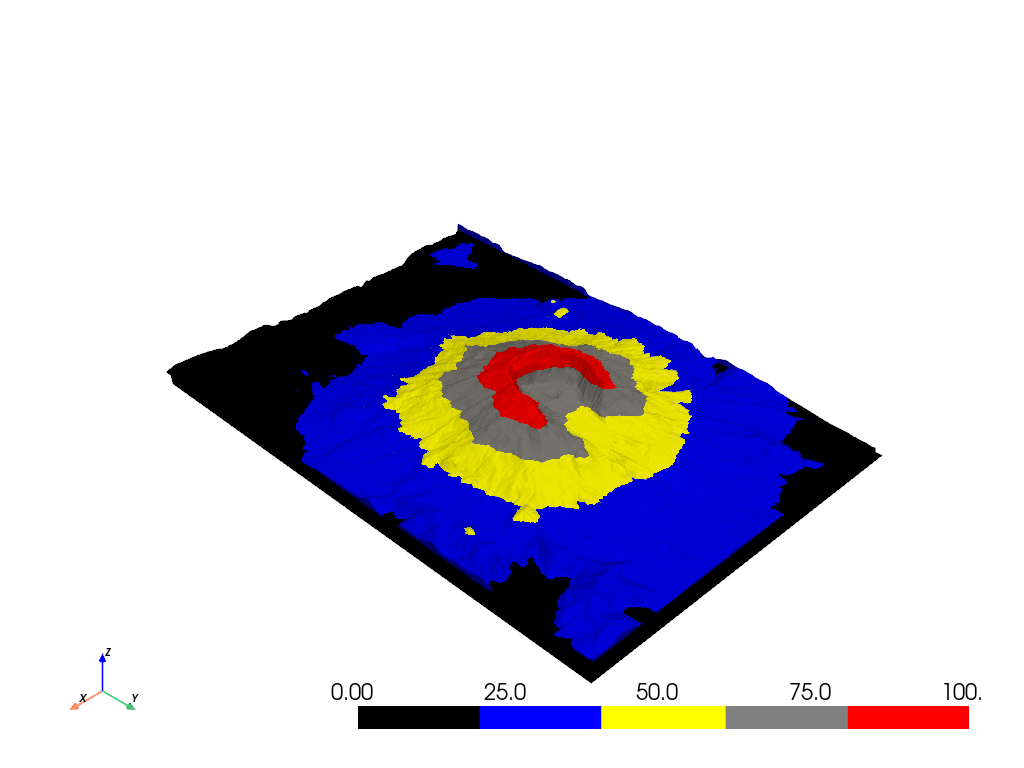
カラー文字列のリストをカラーマップに渡すこともできます.この方法では,カラーマップは5等分されます.
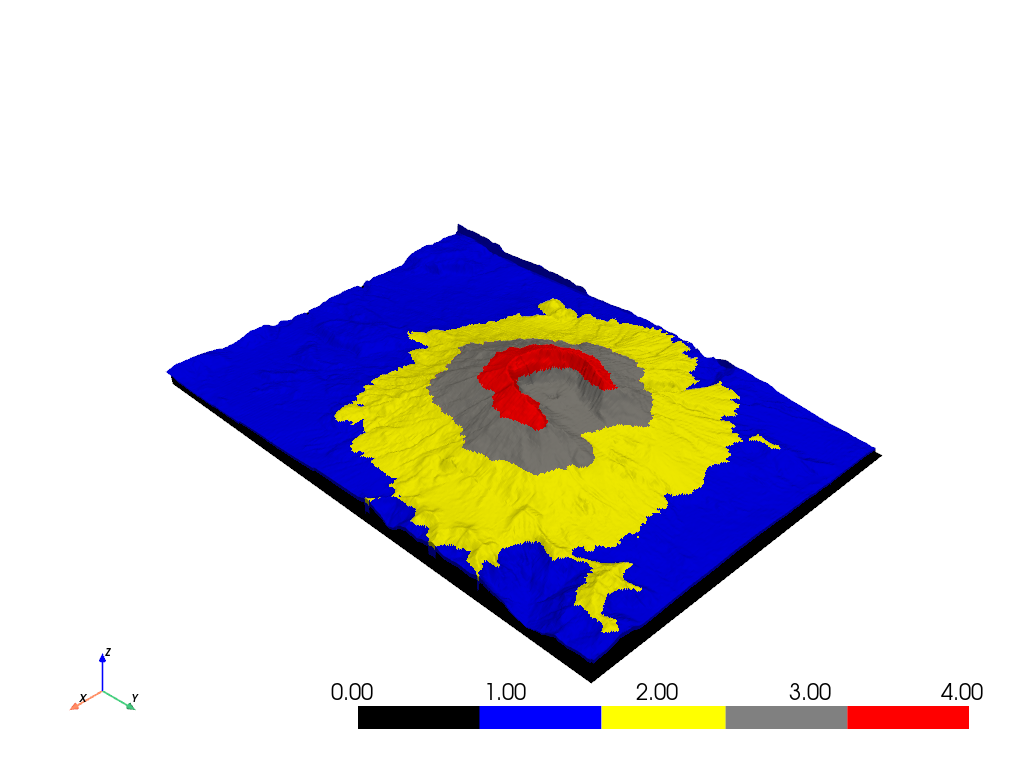
値の分離を制御したい場合は,スカラー配列を作成し,それをカラーマップとともにプロッタに渡すことで制御できます.
scalars = np.empty(mesh.n_points)
scalars[mesh['values'] >= 80] = 4  # red
scalars[mesh['values'] < 80] = 3  # grey
scalars[mesh['values'] < 55] = 2  # yellow
scalars[mesh['values'] < 30] = 1  # blue
scalars[mesh['values'] < 1] = 0  # black

mesh.plot(scalars=scalars, cmap=['black', 'blue', 'yellow', 'grey', 'red'])
Matplotlib対Colorcet#
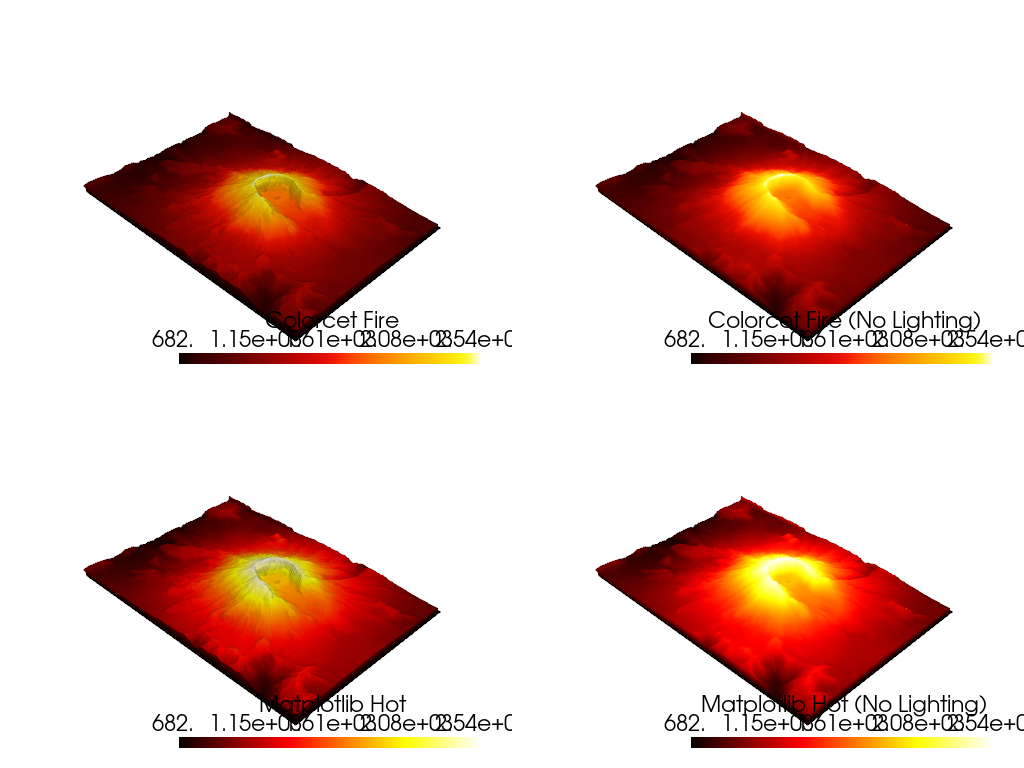
Colorcetの知覚的に一様な "fire" カラーマップとMatplotlibの "hot" カラーマップを first page of Colorcet's docs の例のように比較してみましょう.
"hot" バージョンは,画像が露出オーバーであるかのようにハイエンドのディテールを洗い流しますが, "fire" バージョンは,データ範囲を通してディテールを可視化します.
"fire" を含むColorcetのカラーマップを使用するには,Python環境にColorcetをインストールしておく必要があることに注意してください: pip install colorcet
p = pv.Plotter(shape=(2, 2), border=False)
p.subplot(0, 0)
p.add_mesh(
    mesh,
    scalars='Elevation',
    cmap='fire',
    lighting=True,
    scalar_bar_args={'title': 'Colorcet Fire'},
)

p.subplot(0, 1)
p.add_mesh(
    mesh,
    scalars='Elevation',
    cmap='fire',
    lighting=False,
    scalar_bar_args={'title': 'Colorcet Fire (No Lighting)'},
)

p.subplot(1, 0)
p.add_mesh(
    mesh,
    scalars='Elevation',
    cmap='hot',
    lighting=True,
    scalar_bar_args={'title': 'Matplotlib Hot'},
)

p.subplot(1, 1)
p.add_mesh(
    mesh,
    scalars='Elevation',
    cmap='hot',
    lighting=False,
    scalar_bar_args={'title': 'Matplotlib Hot (No Lighting)'},
)

p.show()
Total running time of the script: (0 minutes 12.036 seconds)